
Why Personal Baselines Beat Population Averages
Date Published
Aug 17, 2026Time to Read
7 min
A population average describes a group, and a population reference range describes where the great majority of values in that group fall. Neither one describes you. For most physiological measures the spread between people is considerably wider than the spread within any one person over time, and that is the practical case for a personal baseline: it's the reference that turns a number from a ranking into a measurement of change.
Key Takeaways
- A population reference interval is built to cover almost all values in a reference group, which makes it far wider than the range any single person normally occupies.
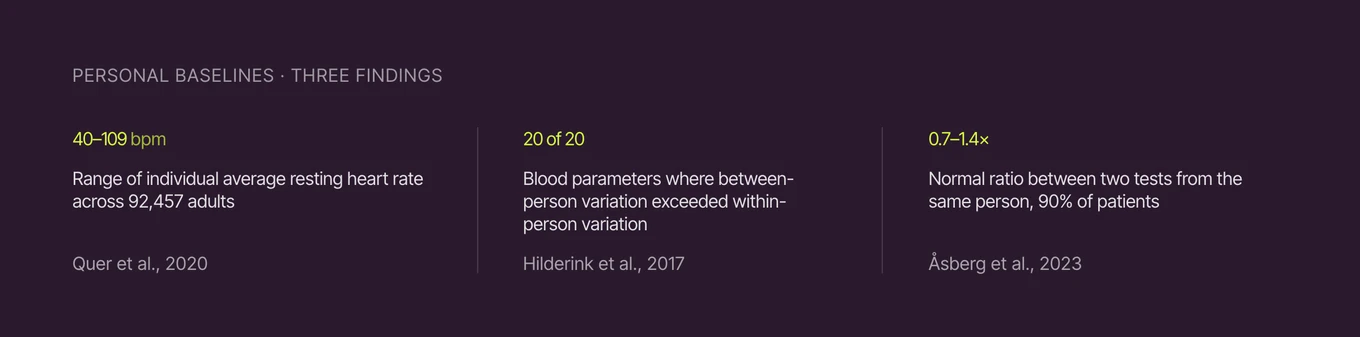
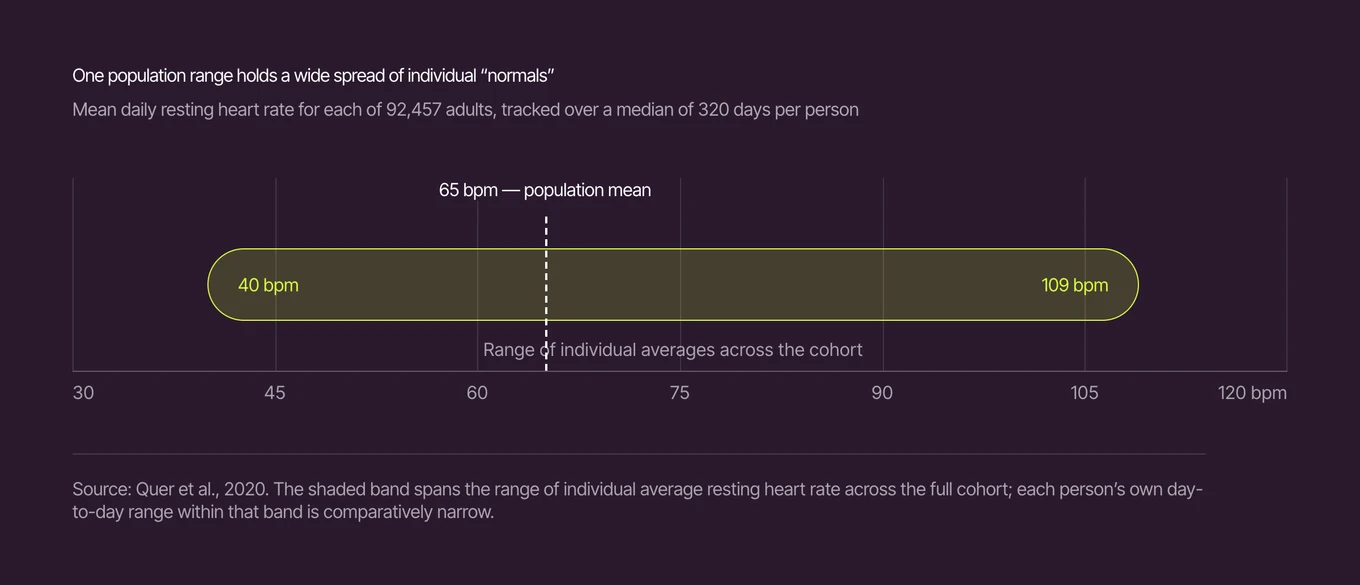
- Among 92,457 adults wearing wrist trackers, mean daily resting heart rate spanned 40–109 bpm across individuals, while each person's own value stayed comparatively consistent over time.
- Population data still does work a personal baseline cannot do, including tying a measured level to long-term outcome risk and making sense of a first-ever measurement.
Who the reference range was actually built for
A reference range gets read as the range of healthy values for you. Actually it's a description of a group: measurements taken from a reference population, then summarized so that almost every member of it falls inside. Nothing in that construction is aimed at any individual member.
Coskun and colleagues put it plainly in their review of reference intervals, noting that in current practice a patient is treated as a member of a population group rather than as an individual, and that such data has real limitations as the reference for one person (Coskun et al., 2022).
If you've ever looked at a lab report and read the range beside your number as a statement about your body, you've met that limitation from the inside. The range isn't broken. It's doing the job it was designed for, and describing one person was never that job.
Why the spread between people is wider than the spread within you
Biological variation splits into two quantities worth keeping apart. Within-subject variation describes how much one person's measurements move around their own set point. Between-subject variation describes how far apart different people's set points sit. Which of the two runs larger decides how much a population interval can tell you.
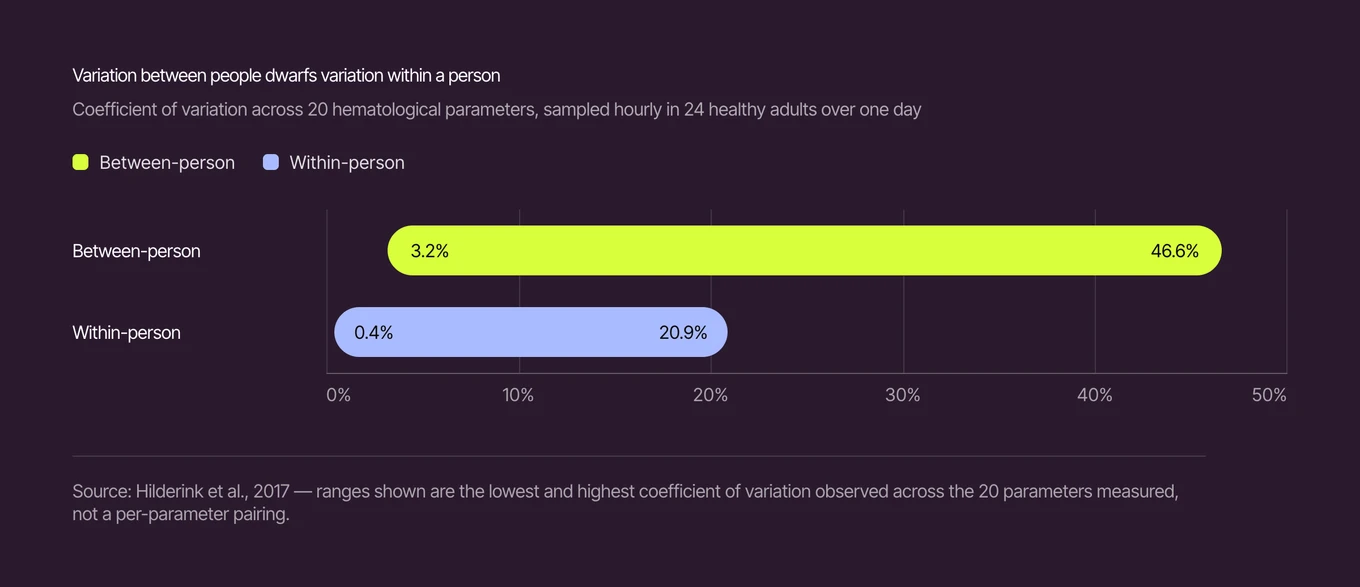
Hilderink and colleagues sampled 24 subjects every hour for 24 hours under standardized conditions and measured 20 hematological parameters. Every one of the 20 showed higher between-subject than within-subject variation, with between-subject values running from 3.2% for mean corpuscular hemoglobin concentration up to 46.6% for eosinophils, against within-subject values of 0.4% to 20.9% (Hilderink et al., 2017). Twenty out of twenty, all pointing the same way. Those figures come from 24 people sampled across a single day, so the direction rather than the magnitude is the part that generalizes.
The same shape turns up at consumer scale, in a measure you can watch on your own wrist. Quer and colleagues analyzed nearly 33 million daily resting heart rate values from 92,457 US adults who wore a wrist tracker consistently over two years, a median of 320 days each. Mean daily resting heart rate was 65 bpm. Individual means ranged from 40 to 109 bpm, so one person's normal can differ from another's by as much as 70 bpm while staying much more consistent within each individual over time (Quer et al., 2020).
Then the arithmetic does the rest. If people are spread across 40–109 bpm and your own week-to-week range is a few beats wide, a shift that's large for you disappears inside the population interval. Nothing flags it. Nothing has gone wrong with the interval either. You just aren't what it was built to measure.
When is a difference actually a difference?
Knowing your own range does something a population range can't: it lets you say whether two of your own measurements actually differ. Laboratory medicine has a formal name for that comparison. It's the reference change value, derived from within-subject biological variation together with analytical variation.
Åsberg and colleagues took two blood tests each from 599 outpatients, drawn a median of 258 days apart, and estimated reference change values for the Fibrosis-4 index. In 90% of patients the ratio between the second and the first result fell between roughly 0.7 and 1.4, with within-subject biological variation estimated at 13.9% (Åsberg et al., 2023).
Notice what that permits. A value coming back 30% higher than last time would still sit inside everyday variation for that measure. Higher, and still ordinary. Without a sense of your own variation, you can't tell that apart from a real change.
That's the same logic behind the early physiological shifts described in Your Heart Knows Before You Do: what makes a shift readable is the range it departed from.
Where the average still beats your baseline
Here's the part that gets skipped when this argument is made badly.
Population data does work a personal baseline can't, starting with the one thing only it can do: connect a measured level to an outcome. In a meta-analysis of individual data from one million adults in 61 prospective studies, usual blood pressure was related to vascular mortality across 12.7 million person-years. At ages 40–69, each 20 mm Hg difference in usual systolic pressure was associated with more than a twofold difference in stroke death rate, with no evidence of a threshold down to at least 115/75 mm Hg (Lewington et al., 2002). No amount of personal history produces that mapping. A blood pressure that's been stable at a high level for years is a stable high level, not a personal normal, and population data is how we know.
It's also the only reference available at the start. A personal range has to exist before a reading can be held against it, so a first-ever measurement has nothing but a group to be read against.
And a personal series has a limit of its own. Repeated measurements on one person carry random variation as well as signal, and that variation is sometimes substantial enough to account for all of an apparent difference in response between individuals (Atkinson and Batterham, 2015). Your own numbers don't interpret themselves either.
So the case for a personal baseline isn't that it wins everywhere. It's narrower and stronger than that. A personal reference makes deviation measurable, and measurable deviation is the raw material for every question worth asking, including questions about how your autonomic signals respond to load.
The reference range printed beside a lab result reads like a fact about you. It isn't. It's somebody else's distribution, tidied into your column, and it took clinical laboratory science decades of work on biological variation to say that out loud. A single flagged value can tell you which side of a stranger's line you landed on, and that is the whole of what it can tell you. Enough of your own measurements, taken the same way, reach further: they can show that this value moved, when it started moving, and how far outside your own ordinary it went. That isn't a smaller answer. It's the only one that was ever about you.
References
- Coskun A, Sandberg S, Unsal I, Serteser M, Aarsand AK. Personalized reference intervals: from theory to practice. Crit Rev Clin Lab Sci. 2022;59(7):501–516. PMID: 35579539. doi:10.1080/10408363.2022.2070905
- Hilderink JM, Klinkenberg LJJ, Aakre KM, et al. Within-day biological variation and hour-to-hour reference change values for hematological parameters. Clin Chem Lab Med. 2017;55(7):1013–1024. PMID: 28002028. doi:10.1515/cclm-2016-0716 (retained because it reports within-subject and between-subject variation side by side for 20 parameters under standardized hourly sampling; no newer equivalent found)
- Quer G, Gouda P, Galarnyk M, Topol EJ, Steinhubl SR. Inter- and intraindividual variability in daily resting heart rate and its associations with age, sex, sleep, BMI, and time of year: retrospective, longitudinal cohort study of 92,457 adults. PLoS One. 2020;15(2):e0227709. PMID: 32023264. doi:10.1371/journal.pone.0227709 (retained for cohort size and length of follow-up; no equivalent 92,457 person wearable resting heart rate cohort published since)
- Åsberg A, Løfblad L, Hov GG, Mikkelsen G. Reference change values of FIB-4. Scand J Clin Lab Invest. 2023;83(6):394–396. PMID: 37504797. doi:10.1080/00365513.2023.2241363
- Lewington S, Clarke R, Qizilbash N, Peto R, Collins R. Age-specific relevance of usual blood pressure to vascular mortality: a meta-analysis of individual data for one million adults in 61 prospective studies. Lancet. 2002;360(9349):1903–1913. PMID: 12493255. doi:10.1016/s0140-6736(02)11911-8 (foundational; no later analysis of comparable scale links usual blood pressure to vascular mortality across the full adult age range)
- Atkinson G, Batterham AM. True and false interindividual differences in the physiological response to an intervention. Exp Physiol. 2015;100(6):577–588. PMID: 25823596. doi:10.1113/EP085070 (foundational; the methodological reference on separating real individual response differences from random within-subject variation)
Related reading
- What Is a Baseline and Why Does It Take Two Weeks to Build?
A baseline is not an average but a range: a center point plus the width your readings normally move within. Two weeks is what both parts need.
- Why Does the Same Routine Work for One Person and Not Another?
The average effect of a routine is not your effect, and much of what looks like individual variation is noise. Here is what real response is.
- When The Numbers Talk Back
Your body speaks in patterns, not snapshots, and here's how to interpret the signals.