
Why Does the Same Routine Work for One Person and Not Another?
Date Published
Aug 17, 2026Time to Read
7 min
Two things explain most of it, and they're easy to confuse. Part of the difference is genuine: people carry different physiology into the same intervention, and for some outcomes those differences reproduce when the intervention is repeated. But a large share of what looks like individual variation in any single trial is within person fluctuation and regression to the mean, which can manufacture convincing responders and non-responders even when the true effect is identical for everyone.
Key Takeaways
- An average effect describes the group, not you, so a routine with a small mean effect can still contain people who moved a lot and people who did not.
- A single before and after comparison cannot separate real individual response from ordinary within person variation, because both produce the same scatter of change scores.
- When the exposure is repeated, some response differences hold up, including neurobehavioral impairment after sleep loss, while others disappear once trial to trial variation is counted.

How a single trial invents responders
When a trial reports that twelve weeks of training raised aerobic fitness by some amount, that number is the center of a distribution. It isn't a promise made to anyone inside it. Whether it also describes you is the difference between "this routine isn't built for my physiology" and "I only looked once, in a week where several other things were also moving." Both feel identical from the inside. Neither feeling is evidence. The gap between what a change feels like and what it measurably did is a recurring theme in physiological versus perceived stress.
If you've ever given a routine a fair run, felt nothing, and concluded that your body just doesn't work that way, that's a reasonable guess. It isn't a measurement.
Here's the trap underneath most of the responder literature. Measure any physiological quantity twice in the same person, with nothing done in between, and the two values won't match. Not even with laboratory grade tools. Now hand everyone the same intervention and plot each person's change. People who measured low at the start tend to move up, people who measured high tend to move down, and the plot fans out into apparent big responders and apparent non-responders. Atkinson and Batterham built exactly that demonstration with a simulated set of blood pressure measurements in which the true response was identical in every individual, and the familiar plots still suggested large individual differences. Their conclusion: within person random variation is sometimes so substantial that it explains all of the apparent individual response, and the popular ways of displaying individual differences are contaminated by that variation and by the regression to the mean artifact (Atkinson and Batterham, 2015).
Nobody in that simulation responded differently. The plots said otherwise.
What it takes to show the difference is real
The fix is structural, not statistical. To claim that people truly respond differently, you compare the spread of change scores in the intervention group against the spread in a comparator group over the same duration. If those two spreads are similar, there's nothing left to explain, and no reason to go hunting for moderators.
Applied to the aerobic fitness literature, that test produced a sobering result. Of six relevant pre HERITAGE studies, only one included a comparator arm. Reanalyzed with within subject variation accounted for, that study showed no clinically important individual differences in the VO2max response. The standard deviation of change was actually larger in the comparator group, at ±5.6 mL/kg/min, than in the training group at ±3.7 mL/kg/min (Williamson et al., 2017).
Sit with that comparison for a second. The spread that was supposed to reveal individual response to training came out wider in the arm that wasn't training. Whatever produced it, the training didn't.
Where the differences hold up, and where they vanish
The design that settles it repeats the exposure in the same people. If your response is real, your first response should predict your second.
Sometimes it does. Twenty one healthy adults aged 21–38 each underwent 36 hours of total sleep deprivation on three separate occasions. Interindividual differences in neurobehavioral impairment were systematic and stable within individuals, and they weren't explained by prior sleep history or by baseline functioning, which the authors described as trait like differential vulnerability (Van Dongen et al., 2004). Three exposures, and the same differences came back each time.
Sometimes it doesn't, and the split can run straight through a single study. In a replicate crossover of breakfast in 12 healthy active men, the 2-hour insulin response showed meaningful interindividual variability, with a between person response spread of about 11.7 pmol/L. The reactive hypoglycemia response showed none that could be detected (Gonzalez et al., 2024). Same people. Same meals. Same trial. Whether individual response exists turned out to be a question about the outcome, not only about the person.
Why a personalized plan can still miss
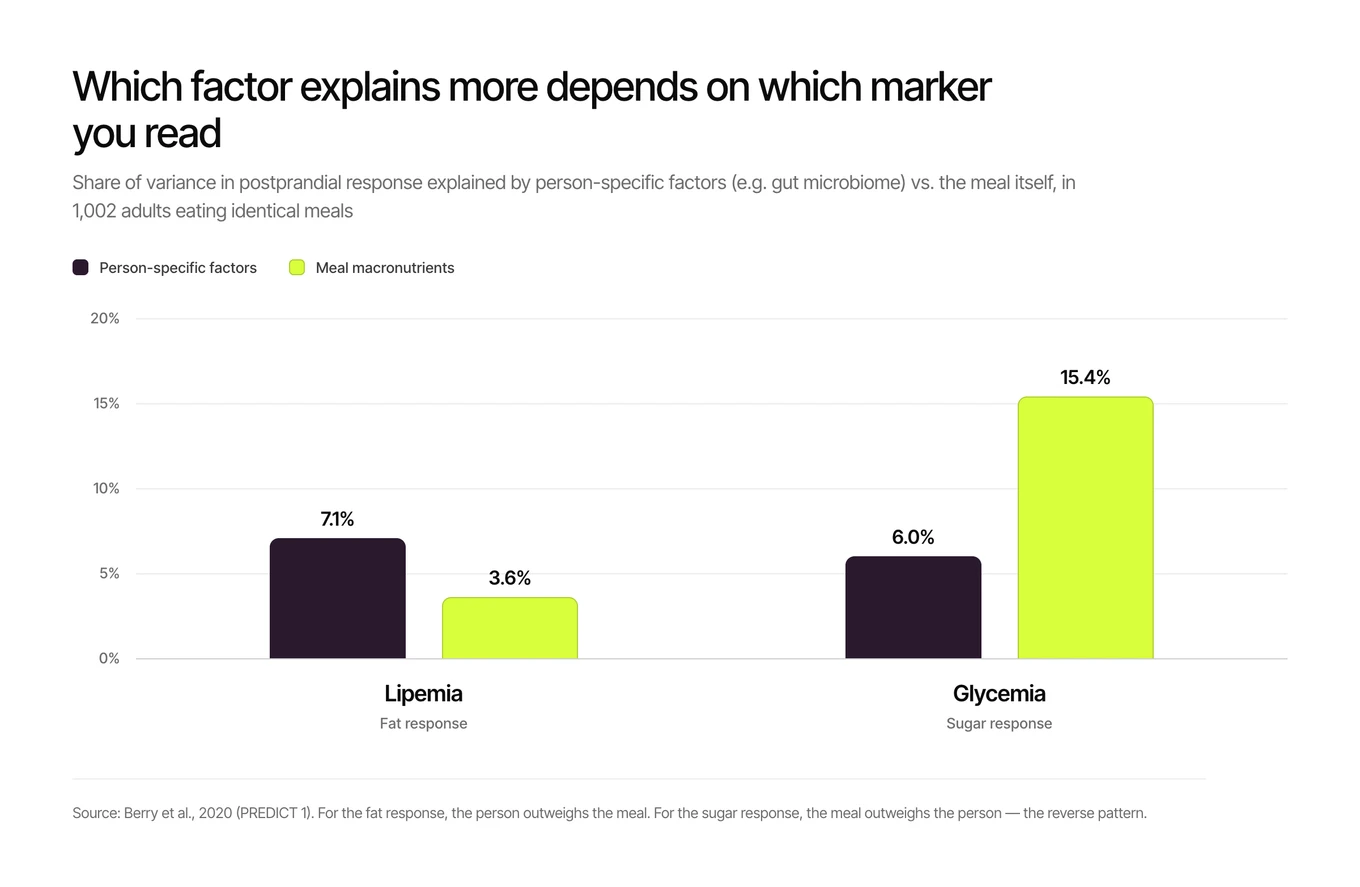
Food is where person specific factors are easiest to demonstrate. In PREDICT 1, 1,002 twins and unrelated healthy adults in the United Kingdom ate identical meals, and the population coefficient of variation in postprandial response reached 103% for triglyceride, 68% for glucose and 59% for insulin. Person specific factors such as the gut microbiome accounted for more of the postprandial lipemia response than meal macronutrients did, at 7.1% versus 3.6%, while for glycemia that reversed, at 6.0% versus 15.4% (Berry et al., 2020). So whether the food or the person counted for more depended on which marker you read.
Here's where personalization looks like it's about to pay off, and where the evidence stops cooperating. Real variation isn't the same as predictable variation. DIETFITS randomized 609 adults to a healthy low fat or healthy low carbohydrate diet for 12 months. Mean weight change was -5.3 kg and -6.0 kg, a between group difference of 0.7 kg. Neither pre specified predictor of who should do better on which diet held up: no significant diet by genotype pattern interaction, and no diet by insulin secretion interaction (Gardner et al., 2018). The spread of individual outcomes was real. It just wasn't predicted by the biology that was supposed to explain it. Knowing that people differ doesn't tell you which side of a difference you're on.
So the honest version of personalized health is narrower than the advertised one. One exposure can't tell you whether a routine suits you, and one exposure is what most of us give it before deciding.
The internet is full of protocols that demonstrably worked for someone, and most of those accounts are probably true. Somebody tried a thing, looked once, and the number moved. The problem is that a number moves whether or not the routine did anything, so an honest testimonial and a coincidence look exactly alike from outside, and nothing in the telling sorts one from the other. You can't blind yourself to your own routine either. You can do the other half: repeat the exposure, and compare the change against your own history rather than against a published average or somebody else's before and after. Repetition won't promise you that a routine works. It can tell you whether what you saw the first time comes back, and that's the one thing no testimonial can give you. That's the logic behind reading what your own numbers are saying back to you.
References
- True and false interindividual differences in the physiological response to an intervention. Atkinson G, Batterham AM. Exp Physiol. 2015;100(6):577-88. PMID: 25823596. doi:10.1113/EP085070 (foundational methodological paper, no equivalent newer treatment)
- Inter-individual responses of maximal oxygen uptake to exercise training: a critical review. Williamson PJ, Atkinson G, Batterham AM. Sports Med. 2017;47(8):1501-1513. PMID: 28097487. doi:10.1007/s40279-017-0680-8 (critical review of the VO2max response literature, no newer equivalent)
- Systematic interindividual differences in neurobehavioral impairment from sleep loss: evidence of trait-like differential vulnerability. Van Dongen HP, Baynard MD, Maislin G, Dinges DF. Sleep. 2004;27(3):423-33. PMID: 15164894. (foundational repeated exposure design)
- Are there interindividual differences in the reactive hypoglycaemia response to breakfast? A replicate crossover trial. Gonzalez JT, Lolli L, Veasey RC, Rumbold PLS, Betts JA, Atkinson G, Stevenson EJ. Eur J Nutr. 2024;63(8):2897-2909. PMID: 39231870. doi:10.1007/s00394-024-03467-y
- Human postprandial responses to food and potential for precision nutrition. Berry SE, Valdes AM, Drew DA, et al. Nat Med. 2020;26(6):964-973. PMID: 32528151. doi:10.1038/s41591-020-0934-0
- Effect of low-fat vs low-carbohydrate diet on 12-month weight loss in overweight adults and the association with genotype pattern or insulin secretion: the DIETFITS randomized clinical trial. Gardner CD, Trepanowski JF, Del Gobbo LC, et al. JAMA. 2018;319(7):667-679. PMID: 29466592. doi:10.1001/jama.2018.0245 (prespecified test of two leading predictors of diet response)
Related reading
- Why Personal Baselines Beat Population Averages
A population average describes a group, not you. Here is why your own physiological range is the reference that makes real change measurable.
- What Is a Baseline and Why Does It Take Two Weeks to Build?
A baseline is not an average but a range: a center point plus the width your readings normally move within. Two weeks is what both parts need.
- When The Numbers Talk Back
Your body speaks in patterns, not snapshots, and here's how to interpret the signals.