
What Is VO2 Max and Why Does It Matter?
Date Published
Aug 17, 2026Time to Read
7 min
VO2 max is the highest rate at which your body can take in oxygen, deliver it to working muscle and use it, measured during progressively harder exercise and reported in milliliters per kilogram of body weight per minute. It sets the ceiling on your aerobic work, and across large cohort studies it's one of the strongest available predictors of long-term mortality and chronic disease risk. Age and sex shape the number heavily, so what carries information in practice isn't where it lands on a chart. It's the direction it moves over months.
Key Takeaways
- VO2 max describes how much oxygen your whole body can use per minute at maximal effort, which makes it a system-level number rather than a measure of lung or heart size.
- Published reference values differ sharply by age and sex, so a raw value means little until you know which cohort it is compared against.
- A series of readings over months carries more information than any single test, because one measurement cannot separate a real change from ordinary variation.
What VO2 max actually measures
The laboratory test is a graded treadmill or cycle protocol with expired gas collection, run until effort can't be sustained. If oxygen uptake plateaus, the peak value is called VO2 max. Without a clear plateau it's usually reported as VO2 peak, and clinical literature uses the two terms nearly interchangeably.
Then there's the question of what the number is made of, and this is where the usual mental picture goes wrong. Physiologically it's the product of two things: how much blood your heart moves per minute, and how much oxygen your muscles pull out of it. Both sides can shift. VO2 max has been reported to rise after several weeks of brief vigorous exercise with no measurable change in cardiac output, which points to greater oxygen extraction at the muscle as one route to improvement (Gibala and Little, 2020). So a rising VO2 max isn't evidence that one organ got bigger. It's the whole chain from lungs to mitochondria getting better at moving and using oxygen.

Why the number predicts more than performance
Aerobic fitness got taken seriously as a health measure for a reason. An overview of 26 systematic reviews, representing more than 20.9 million observations from 199 cohort studies, compared high with low cardiorespiratory fitness and found all-cause mortality risk substantially lower in the fitter group (HR 0.47, 95% CI 0.39 to 0.56), with each 1 metabolic equivalent higher associated with 11% to 17% lower risk (Lang et al., 2024). The authors graded certainty across the underlying studies from very low to moderate.
That's a strong signal. It's also one axis. VO2 max says nothing directly about strength, glucose regulation, blood pressure or sleep continuity, and two people with the same value can be on opposite trajectories. Read alongside other signals, it's informative. Read alone, it's a single coordinate.
What VO2 max by age looks like, and why your trend says more
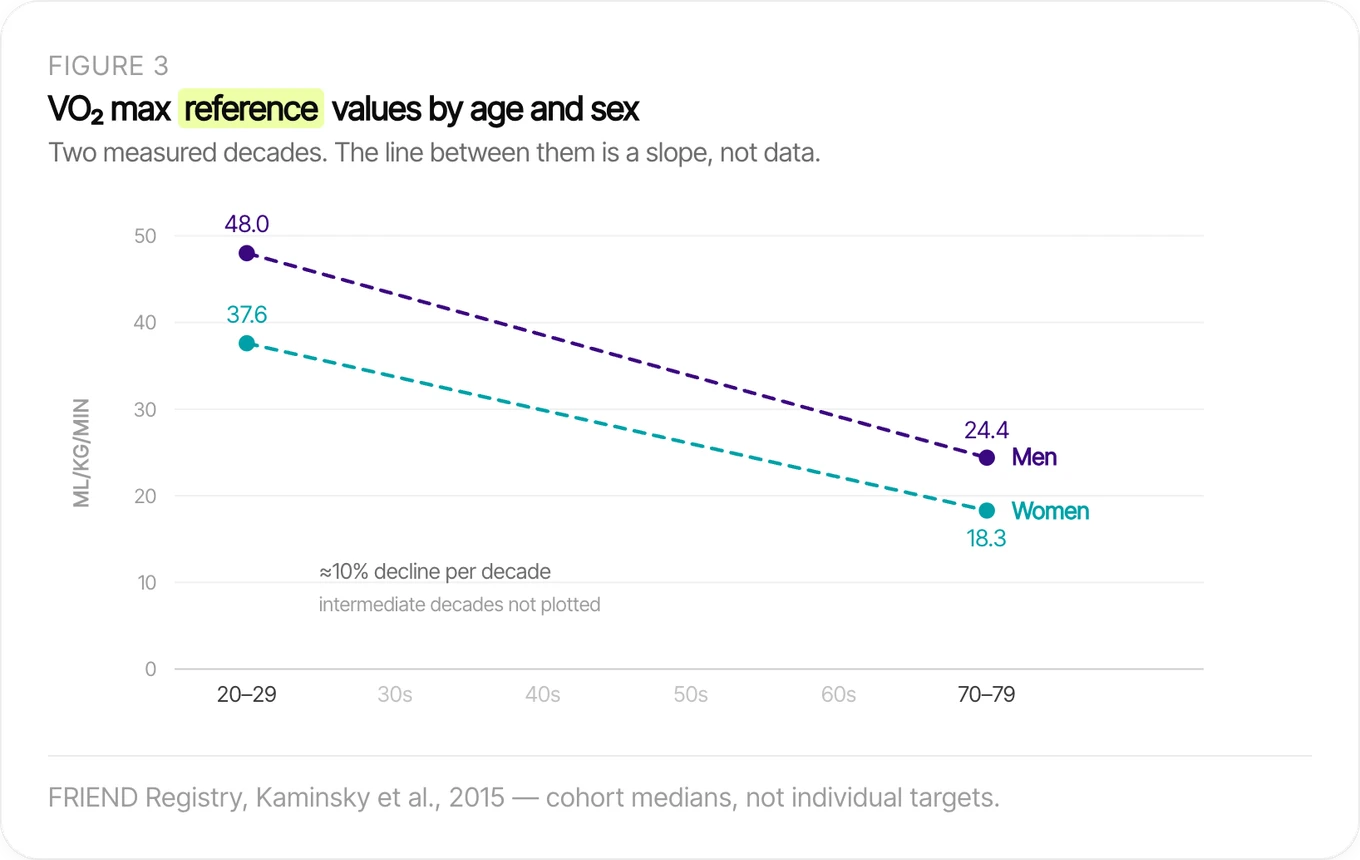
Interpretation depends on the cohort behind the chart. The first US reference standards measured directly with cardiopulmonary exercise testing were built from 7,783 maximal treadmill tests in men and women aged 20–79 without cardiovascular disease (Kaminsky et al., 2015). In that FRIEND registry cohort, the 50th percentile for ages 20–29 was 48.0 mL/kg/min in men and 37.6 in women, falling to 24.4 and 18.3 by ages 70–79, a decline of roughly 10% per decade. Those figures describe that cohort. They aren't a target.
If you've ever looked your own reading up in an age table and come away either reassured or quietly alarmed, that's the moment worth slowing down on. The table told you where several thousand tested adults sat. It didn't say anything about you.
Change over time has been studied as an exposure in itself. Among 30,375 apparently healthy Norwegian adults whose fitness was estimated twice, ten years apart, those who moved out of the least fit fifth into the fit group had lower risk of incident dementia than those who stayed unfit (adjusted HR 0.52, 95% CI 0.30 to 0.90), and gained 2.2 dementia-free years and 2.7 years of life (Tari et al., 2019). The exposure there was the shift between two readings. Not either reading alone.
One value tells you where you sit against a cohort you may not resemble. A series tells you what your own physiology is doing, the comparison that responds to anything you change. Reading it well means knowing the width of your own normal variation first, the same discipline that applies when any tracked number starts moving.
How much training moves VO2 max
Here's where the literature looks like it's arguing with itself.
One trial randomized 84 healthy young adults into six matched groups of 14, cycling three times a week for six weeks, with intensity set by each person's own measured physiological domain rather than a fixed percentage. Mean VO2 max change was 0.1 mL/kg/min in the non-training control group and 1.8 in the moderate-intensity group, which wasn't statistically distinguishable from control. Every group training above the moderate domain improved significantly, from 3.3 mL/kg/min in the lower heavy group to 6.2 in high-intensity intervals (Inglis et al., 2024).
Pooled evidence reads at first like the opposite. Across eight randomized trials totaling 169 adults, VO2 peak rose by 3.10 mL/kg/min with moderate-intensity continuous training and 1.75 with sprint intervals (Liang et al., 2024). Moderate work ahead of intervals, and ahead of the trial's own moderate figure. Except those two numbers aren't the same quantity. The 1.8 is a contrast against people who didn't train at all, at 14 participants per arm. The 3.10 is a pre-to-post change inside the continuous-training arms, with no untrained comparator. "Moderate" also means different things in the two: the trial held every participant below their own measured threshold, while the pooled trials prescribed a percentage of heart rate or oxygen uptake, which pushes some people above their own threshold and into the domains the trial found effective. And the estimates overlap anyway, since the pooled interval runs from 1.03 to 5.18 and contains 1.8.
So the evidence is mixed on how much strictly sub-threshold work raises VO2 max. It isn't mixed on what sits above it. Every above-moderate arm in the trial beat control, and sprint intervals raised VO2 peak in the pooled review too. Lower-intensity aerobic work mostly travels under the heading of zone 2 training, which names an intensity range rather than a guaranteed outcome.
VO2 max has turned into a longevity headline, a single figure quoted like a verdict. It isn't a verdict. It's one axis of fitness, scored against cohorts you never met, and the part of it that answers to how you actually live is the part a percentile can't show you. So the readable question was never which band you landed in. It's which way your last few readings point, and whether they've pointed that way long enough to mean something. One test can't tell you that. A run of them mostly can.
References
- Gibala MJ, Little JP. Physiological basis of brief vigorous exercise to improve health. The Journal of Physiology. 2020;598(1):61–69. PMID: 31691289. doi:10.1113/JP276849
- Lang JJ, Prince SA, Merucci K, et al. Cardiorespiratory fitness is a strong and consistent predictor of morbidity and mortality among adults: an overview of meta-analyses representing over 20.9 million observations from 199 unique cohort studies. British Journal of Sports Medicine. 2024;58(10):556–566. PMID: 38599681. doi:10.1136/bjsports-2023-107849
- Kaminsky LA, Arena R, Myers J. Reference standards for cardiorespiratory fitness measured with cardiopulmonary exercise testing: data from the Fitness Registry and the Importance of Exercise National Database. Mayo Clinic Proceedings. 2015;90(11):1515–1523. PMID: 26455884. doi:10.1016/j.mayocp.2015.07.026 (foundational; first US reference standards measured directly with cardiopulmonary exercise testing)
- Tari AR, Nauman J, Zisko N, et al. Temporal changes in cardiorespiratory fitness and risk of dementia incidence and mortality: a population-based prospective cohort study. The Lancet Public Health. 2019;4(11):e565–e574. PMID: 31677775. doi:10.1016/S2468-2667(19)30183-5 (retained because change in fitness, rather than a single measurement, is the exposure; no newer equivalent found)
- Inglis EC, Iannetta D, Rasica L, et al. Heavy-, severe-, and extreme-, but not moderate-intensity exercise increase VO2max and thresholds after 6 wk of training. Medicine and Science in Sports and Exercise. 2024;56(7):1307–1316. PMID: 38376995. doi:10.1249/MSS.0000000000003406
- Liang W, Liu C, Yan X, et al. The impact of sprint interval training versus moderate intensity continuous training on blood pressure and cardiorespiratory health in adults: a systematic review and meta-analysis. PeerJ. 2024;12:e17064. PMID: 38495758. doi:10.7717/peerj.17064
Related reading
- What Is Zone 2 Training and Why Is Everyone Talking About It?
Zone 2 names a low intensity training range, but percentage based heart rate zones map poorly onto the individual thresholds they are meant to track.
- How Long Does It Take to Lose Your Fitness?
Fitness is not one adaptation, so it does not fade on one clock. Here is how fast insulin sensitivity, stroke volume and VO2 max actually change.
- Biological Age vs. Chronological Age: What's the Difference?
Chronological age counts years since birth. Biological age is an estimate from measurable markers, and different methods return different numbers.