
What Is Zone 2 Training and Why Is Everyone Talking About It?
Date Published
Aug 17, 2026Time to Read
7 min
Zone 2 training refers to sustained aerobic work held at an intensity low enough that blood lactate stays near resting levels and breathing stays conversational. It draws argument because the label went into wide use before anyone settled where its boundaries sit. And when those boundaries come from a percentage of maximum heart rate rather than a measured threshold, the same percentage doesn't land in the same physiological territory from one person to the next.
Key Takeaways
- An expert panel convened to define zone 2 concluded the term should refer to intensities immediately below the first lactate or ventilatory threshold, and noted that no clear consensus existed beforehand.
- In a cohort of 100 adults, the lactate threshold occurred anywhere between 60% and 90% of maximal heart rate, so the 72% to 82% band commonly used to define zone 2 cannot sit below that boundary for everyone.
- Low and moderate intensity continuous training raised muscle mitochondrial content by an amount statistically indistinguishable from harder formats in a large pooled dataset, though far less per hour of exercise.
What zone 2 was supposed to mean
The physiological idea underneath the label is a boundary, not a band. Below the first lactate threshold, lactate gets cleared about as fast as it's produced, so blood concentration holds near baseline. Above it, lactate accumulates. That's the entire distinction.
A term this widely used ought to have arrived with a definition attached. This one didn't. It went into circulation first and got defined afterward.
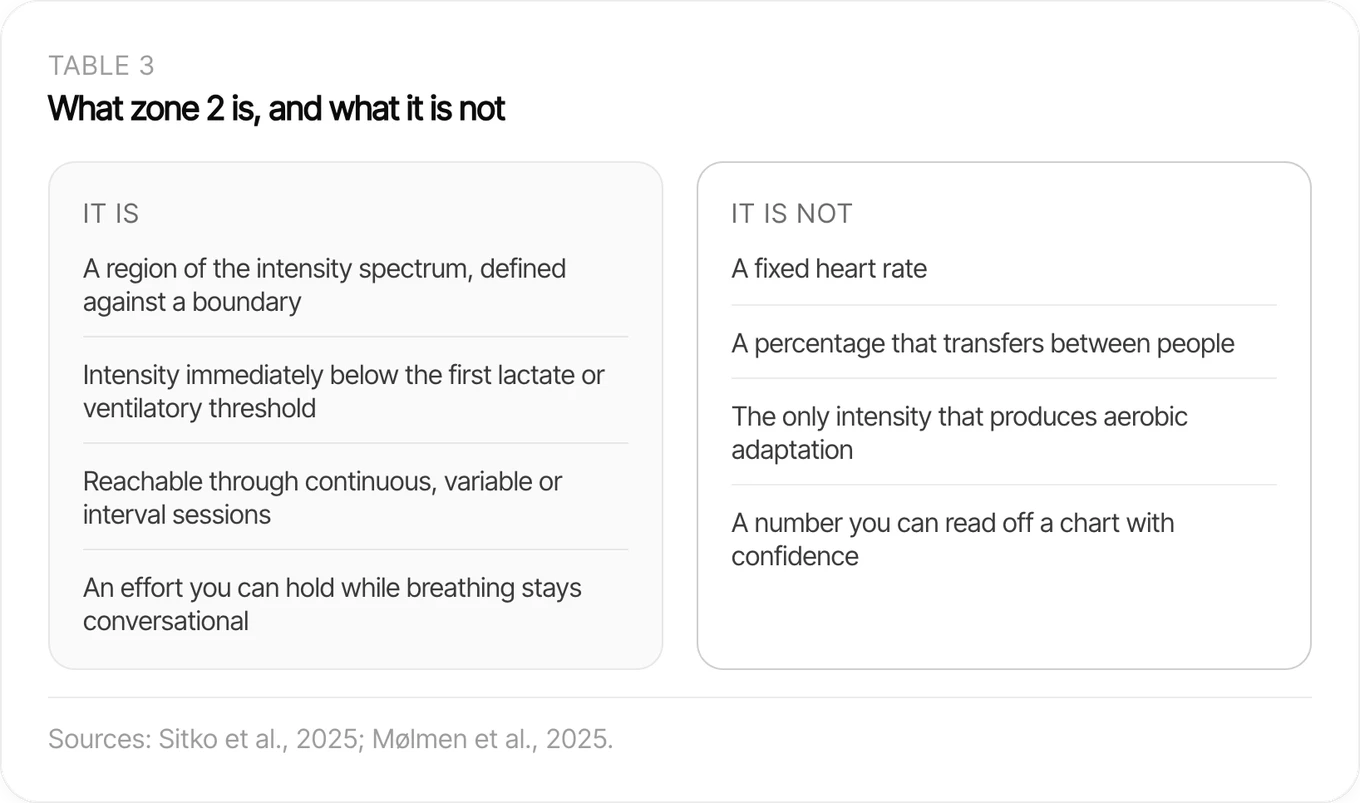
Fourteen applied sport scientists and professional coaches were assembled to settle what it should mean, and their commentary opens by noting that no clear consensus existed among coaches, athletes and scientists (Sitko et al., 2025). The panel agreed zone 2 should preferably be performed immediately below the first lactate or ventilatory threshold, through continuous, variable or interval sessions. They expected a broad range of central and peripheral adaptations there. They also allowed that those adaptations might not be unique to zone 2, and could follow from sessions slightly above or below it.
So the panel described a region of the spectrum. Not a switch that flips at one heart rate.
Your zone 2 heart rate is not a percentage
If you've ever taken a zone 2 target off a chart or an app, it almost certainly came from a percentage of your maximum. In the five zone model used by the Norwegian Olympic Federation, zone 2 runs from 72% to 82% of maximal heart rate, and a comparison of zone 2 definitions in 50 cyclists, 30 men and 20 women, calls that band a widely used definition of the zone (Meixner et al., 2025). In those cyclists, fixed percentages of maximal heart rate exhibited wide individual differences.
The band gets treated as a stand in for the threshold. Actually the two come apart, and the gap has been measured.
Ramp incremental tests plus 30 minute constant work rate trials in 100 individuals, 46 women and 54 men, located the lactate threshold and the maximal lactate steady state in everyone (Iannetta et al., 2020). As a percentage of maximal heart rate, the lactate threshold occurred anywhere from 60% to 90%. The maximal lactate steady state, from 75% to 97%. As a percentage of VO2 max the ranges were 45% to 74% and 69% to 96%. Fixed percentage methods, the authors concluded, conform poorly to intensity domains and don't adequately control the metabolic stimulus. Sex mattered too: both boundaries fell at a greater percentage of VO2 max and maximal heart rate in women.
Thirty percentage points. That's the span the first threshold covered across those 100 people, three times wider than the 10 point band drawn to approximate it. So the same prescription lands well below the threshold for some of them and above it for others. This is the part a percentage can't tell you: which of the two you are.
The mismatch isn't spread evenly either. In 51 recreationally active young adults with a mean age of 24.5 years, fixed anchors based on percentage of maximal heart rate, heart rate reserve and VO2 max approximated the domains defined by ventilatory thresholds only loosely, with misclassification pronounced at the first ventilatory threshold and agreement better at the second (Turnšek et al., 2026). So the arithmetic performs worst at the first threshold, and that's exactly where the consensus definition puts zone 2. Maximal anchors stay useful in their own right, including VO2 max as a marker of aerobic capacity, but they do a different job than marking your thresholds.
What actually changes inside the muscle
The adaptations attributed to zone 2 are real. They're also not exclusive to it. A systematic review and meta regression pooled 5,973 participants across 353 articles for mitochondrial outcomes (Mølmen et al., 2025). After adjustment for training frequency, intervention length and initial fitness, increases in mitochondrial content were similar across low or moderate intensity continuous endurance training (23 ± 5%), high intensity training (27 ± 5%) and sprint interval training (27 ± 7%).
Per hour of exercise, they aren't similar at all. Sprint intervals came out about 2.3 times more efficient than high intensity training and 3.9 times more efficient than continuous endurance training. Low intensity work buys the same adaptation at the worst hourly rate of the three.
Which is a stranger case for it than it sounds. The appeal was never a unique adaptation, and the pooled data is fairly clear that there isn't one. It's that the same adaptation can be reached at a cost low enough to repeat often, week after week. That's a property of the schedule more than of the physiology.
What zone 2 is not
Zone 2 isn't a fixed heart rate, and it isn't a percentage that transfers between people. It names a region defined against a boundary, and that boundary sits in a different place in your physiology than in someone else's.
It started as a line on a laboratory printout: the point where one person's lactate stopped clearing as fast as it appeared. Then it became a number people hold a watch up to. The line survived that trip. The number didn't, because the line was never in the same place twice. Read as a region, zone 2 describes an intensity usefully. Read as a number off a chart, it's a guess about where your own boundary happens to fall. Finding your own doesn't take a lab. It takes the effort you can hold while your breathing stays conversational, then enough sessions at that effort to see what your heart rate actually does there, until the answer stops moving.
References
- Sitko S, Artetxe X, Bonnevie-Svendsen M, et al. What is "zone 2 training"?: experts' viewpoint on definition, training methods, and expected adaptations. Int J Sports Physiol Perform. 2025;20(11):1614–1617. PMID: 40010355. doi:10.1123/ijspp.2024-0303
- Meixner B, Filipas L, Holmberg HC, Sperlich B. Zone 2 intensity: a critical comparison of individual variability in different submaximal exercise intensity boundaries. Transl Sports Med. 2025;2025:2008291. PMID: 40225831. doi:10.1155/tsm2/2008291
- Iannetta D, Inglis EC, Mattu AT, et al. A critical evaluation of current methods for exercise prescription in women and men. Med Sci Sports Exerc. 2020;52(2):466–473. PMID: 31479001. doi:10.1249/MSS.0000000000002147
- Turnšek G, Iskra S, Paravlić AH. Prehypertension in young physically active adults: early vascular alterations and implications for exercise intensity prescription. Front Cardiovasc Med. 2026;13:1853384. PMID: 42445533. doi:10.3389/fcvm.2026.1853384
- Mølmen KS, Almquist NW, Skattebo Ø. Effects of exercise training on mitochondrial and capillary growth in human skeletal muscle: a systematic review and meta-regression. Sports Med. 2025;55(1):115–144. PMID: 39390310. doi:10.1007/s40279-024-02120-2
Related reading
- What Is VO2 Max and Why Does It Matter?
VO2 max is the highest rate your body can take in and use oxygen during hard exercise. Here is what the number reflects and why the trend matters.
- Does Walking Really Count as Exercise?
Walking counts as exercise, but the outcome decides how much. Verified step cohorts and walking trials move some markers and leave others flat.
- How Does Exercise Affect Your HRV?
One workout lowers HRV for hours to days, while weeks of training tend to raise it. What carries information is how fast you return to your own range.